3 Ways Data Dashboards Can Mislead You

jan17-13-9794335

Executives love dashboards, and why wouldn’t they? Single-screen “snapshots” of operational processes, marketing metrics, and key performance indicators (KPIs) can be visually elegant and intuitive. They show just-in-time views of what’s working and what isn’t — no need to wait for weekly or monthly reports from a centralized data center. A quick scan of a dashboard gives frontline managers transparency and, ideally, the opportunity to make rapid adjustments.

But dashboards aren’t the magic view some managers treat them as. Although they can convey snapshots of important measures, dashboards are poor at providing the nuance and context that effective data-driven decision making demands.

Data analytics typically does a few things:

  • describes existing or past phenomena
  • predicts future events based on past data
  • prescribes a course of action

Most dashboards, though, only cover the first — describing what has happened. Moving from description to prediction to action requires knowledge of how the underlying data was generated, a deep understanding of the business context, and exceptional critical thinking skills on the part of the user to understand what the data does (and doesn’t) mean. Dashboards don’t provide any of this. Worse, the allure of the dashboard, that feeling that all the answers are there in real time, can be harmful. The simplicity and elegance can tempt managers to forget about the all-important nuances of data-driven decision making.

To get better at creating and using dashboards, think about these three drawbacks to data dashboards.

The Importance Trap

Every dashboard is built on a set of priorities and assumptions about what’s important. Many times those priorities are defined by IT, a design expert, or a consultant who deploys dashboards and doesn’t know the company that well. Sometimes, the priorities may even be the default measurements provided by the dashboard software.

In many of these cases, companies end up with official-looking views into data that doesn’t align with business priorities.

For instance, a small-business owner may have a dashboard that shows a moving average of his customers’ inter-purchase times. Is this information worthy of “front-page attention” each day? Probably not. Not only does the metric itself require significantly more information to drive action, but it simply doesn’t align with his goals and business model.

It should go without saying that all elements of a dashboard should be relevant and important. If the choice of what information to present in a dashboard is made without the input of those closest to the business context — whether through default software settings or what one person building the dashboard happens to think is important — it is highly unlikely that the dashboard will be maximally useful.

The Context Trap

Too often, we think of analytics as representing some sort of unbiased and dispassionate truth. We equate “empirical” and “quantitative” with “objective.” This dangerous belief leads managers to track and even act on metrics simply because they appear on a dashboard — and, well, dashboards don’t lie, right?

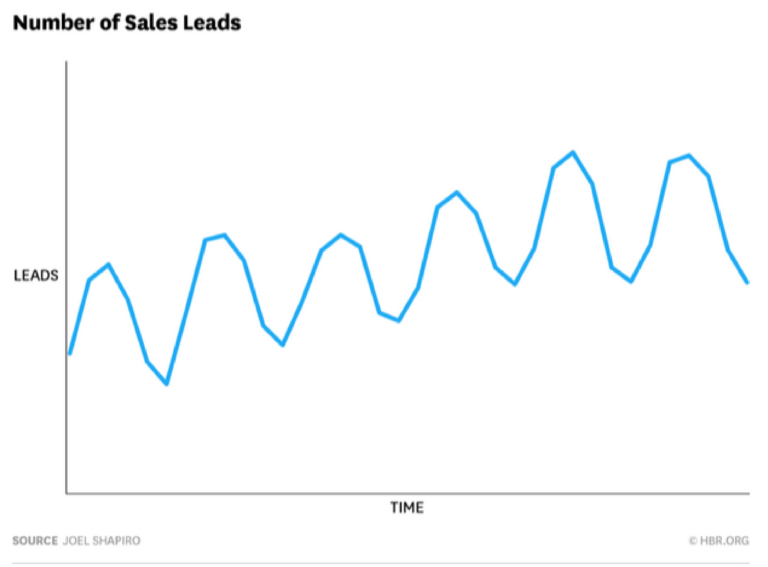
Consider the manager tasked with maximizing sales leads. He helped design a simple view on his dashboard to see how leads are coming in to the company over time. He sees an upward sloping cyclical pattern:

Based on this data, the manager might focus on the period when leads coming in were highest — here, the second-to-last peak — and try to understand the conditions present during that peak period.

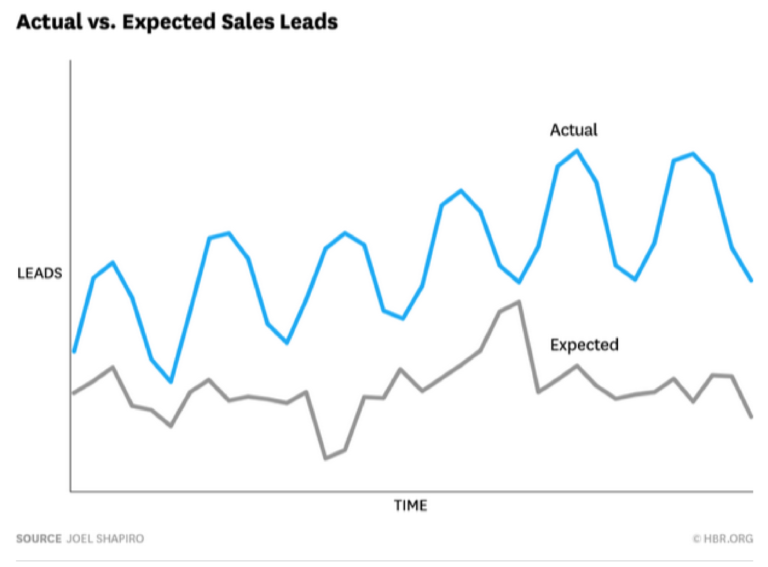
However, one could reasonably argue that the period of greatest “success” in this graphic is actually the point at which the number of leads most exceeds the expected number of leads, given the history of cyclicality and growth. If we overlay a deviation from expected leads curve, a different picture emerges:

In this example, the most notable time period may be where expected leads peak (where the gray line is at its highest) but actual leads are low. A manager who seeks to understand the conditions for lead generation success may want to focus energy there rather than when leads were, and were expected to be, high.

As this example hints at, there are myriad ways to present data. The burden is on the interpreter and user of the dashboard to ensure that the most relevant and useful metric is conveyed.

The Causality Trap

Perhaps the greatest danger in using dashboards for decision making is in misattributing causality when comparing elements on the dashboard.

Comparisons are a dashboard’s bread and butter, such as showing sales by region, financial performance by month, customer inquiries by channel, and so forth.

It’s far too easy — and unfortunately common — for managers to interpret the groupings in a dashboard as causative when they may not be.

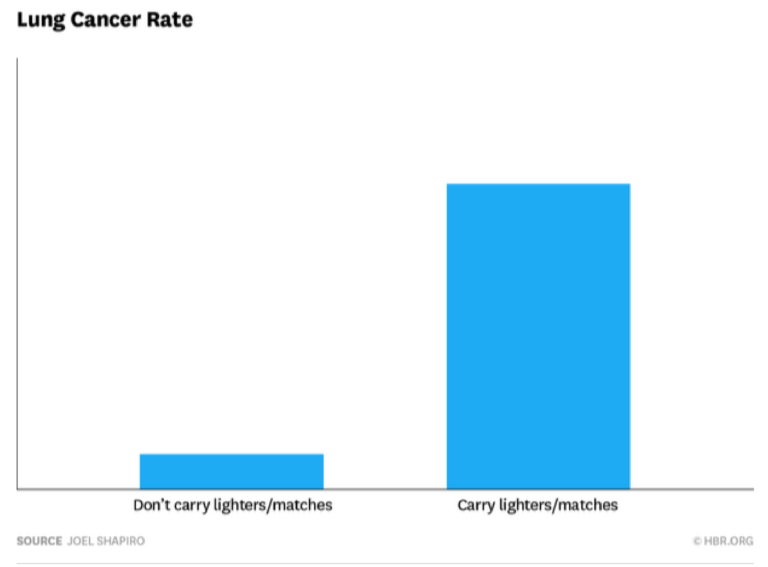
What if you saw a dashboard graphic like the one below, showing a comparison of lung cancer rates between people who carry lighters or matches in their pockets and those who don’t?

Would you conclude from this comparison that carrying lighters and matches causes lung cancer? Probably not. You would instead surmise that people who carry lighters and matches are more likely to smoke, and that smoking causes cancer.

In their specific business context, however, managers frequently fall into the trap of concluding that lighters and matches cause cancer. Dashboards lead them to assign causality when they shouldn’t.

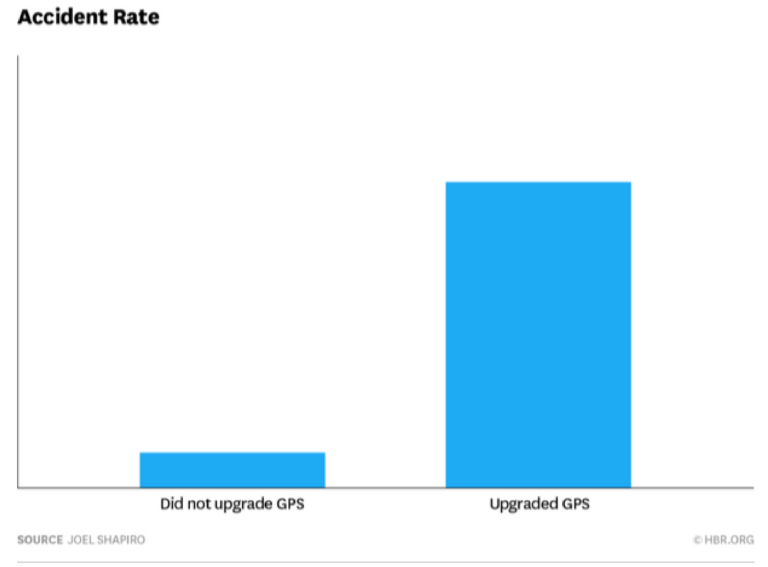
Consider a large package delivery company that wanted to reduce vehicle accidents. To do so, they offered drivers the option to upgrade their GPS to a system that would help them avoid high-risk traffic areas. After monitoring drivers’ behaviors for a week, a frontline manager checked her dashboard and found, to her surprise, that the accident rate was actually higher with the upgrade than without:

Many managers would look at this graphic and assign causality. Drivers who upgraded their GPS were in more accidents, therefore the GPS upgrade backfired miserably.

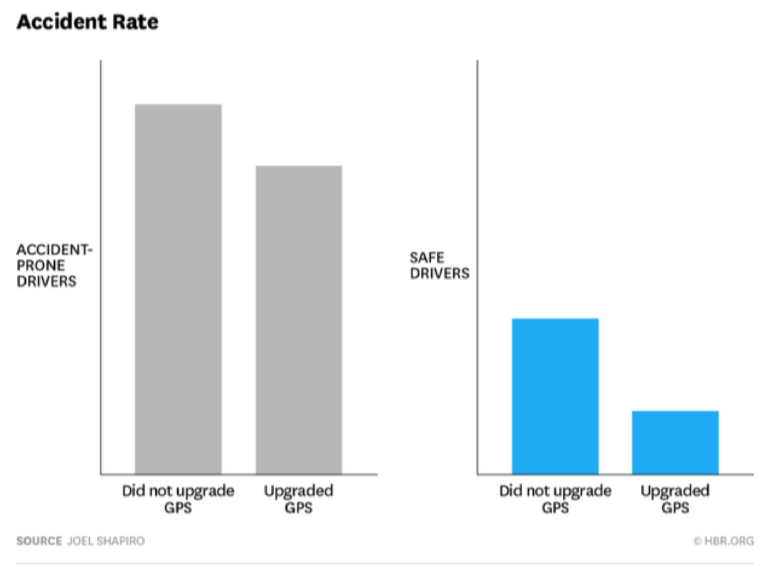
But the upgrade was actually quite effective. The manager would have seen this by comparing accident rates for drivers that the company categorizes as “accident prone” or “safe”:

For both groups, the upgrade made them safer. So why did the accident rate increase for the entire fleet of drivers while decreasing for each group? Because in this case almost all of the accident-prone drivers chose to use the upgraded device and almost all of the safe drivers kept the old device. Preexisting driver behavior was confused with the effectiveness of the upgrade.

Before dashboards, answering the question of whether the upgrade was effective would have required a data-savvy individual, probably someone trained in statistics. This person almost certainly would have asked, “What else, other than the upgrade, might be responsible for the increase in accidents?” The manager’s mistake would have been avoided easily.

But when managers rely only on data dashboards, with the hope and expectation that these visual tools will facilitate decision making, serious shortcomings emerge. Without the nuance and context that dashboards don’t reveal, managers can come to some very wrong conclusions.